EDUR 9131
Advanced Educational Research
Cronbach's Alpha (measure of internal consistency)
To explain Cronbach's alpha, we must first create a research situation in which we wish to assess the degree of internal consistency among a set of indicators (questionnaire items). Assume the target group for our study is doctoral students in this course.
I am interested in learning two things from each student. The first is the level of value that students place on learning Cronbach's alpha. This variable will be called Task Value and represents the degree to which the students believe the task at hand, in this case learning Cronbach's alpha, is valuable for whatever reason. To assess the level of Task Value that students place on learning Cronbach's alpha, the following survey items are used:
Table 1: Task Value Items
| Not at all or only very minimal | To a small degree | To a moderate degree | To a considerable degree | To a great degree | |
| 1. To what degree to you find learning Cronbach's alpha interesting? | 1 | 2 | 3 | 4 | 5 |
| 2. What level or degree of importance do you place on learning Cronbach's alpha? | 1 | 2 | 3 | 4 | 5 |
| 3. How useful do you believe Cronbach's alpha to be to you? | 1 | 2 | 3 | 4 | 5 |
The second variable of interest is the level of anxiety students hold toward learning Cronbach's alpha. This variable will be called Anxiety and it reflects the level of worry and concern one may experience when thinking about learning Cronbach's alpha. To assess this, the following items are used:
Table 2: Anxiety Items
| Not at all or only very minimal | To a small degree | To a moderate degree | To a considerable degree | To a great degree | |
| 1. When you think about learning Cronbach's alpha, to what degree to you begin to feel anxious or nervous? | 1 | 2 | 3 | 4 | 5 |
| 2. To what degree do you worry that learning Cronbach's alpha may be difficult for you? | 1 | 2 | 3 | 4 | 5 |
| 3. When thinking about learning mathematical and statistical concepts, such as Cronbach's alpha, to what level or degree do you begin to feel uncomfortable? | 1 | 2 | 3 | 4 | 5 |
(Note: The above six items are simply for instructional purposes only. They have not been carefully reviewed or field tested. If the scaling steps seem illogical, send me a note so I can revise them -- thanks!)
Assume that these six items are administered to a group of 10 students, and their scores for each of the items are reported below in Table 3. I have added the letters TV to items 1, 2, and 3 to help identify Task Value scores and the letter A to items 4, 5, and 6 to help identify Anxiety scores. Thus, TV1 represents Task Value item 1, and A5 represents Anxiety item 5.
Table 3: Scores on TV and A items from 10 students
| Student | TV1 | TV2 | TV3 | A4 | A5 | A6 |
| A | 4 | 5 | 4 | 1 | 1 | 1 |
| B | 4 | 4 | 5 | 2 | 3 | 4 |
| C | 1 | 3 | 4 | 3 | 3 | 4 |
| D | 2 | 1 | 2 | 2 | 2 | 1 |
| E | 3 | 4 | 3 | 1 | 1 | 1 |
| F | 1 | 1 | 1 | 4 | 4 | 4 |
| G | 5 | 5 | 4 | 5 | 4 | 3 |
| H | 4 | 4 | 4 | 4 | 4 | 5 |
| I | 2 | 3 | 4 | 1 | 2 | 1 |
| J | 1 | 2 | 1 | 5 | 5 | 5 |
From Table 3 we can see that the first student, student A, rated item TV1 a 4, rated item TV2 a 5, and item TV3 a 4. So this student judges the Task Value of Cronbach's alpha to be important, or, more precisely, the average of this student's ratings on these three items falls between a rating of 4 "To a considerable degree" and a rating of 5 "To a great degree." However, in terms of Anxiety produced as a result of having to learn Cronbach's alpha, Student A provided a rating of 1 to all three items which suggests little to no anxiety for this student.
Now that data are collected, we are interested in determining the Cronbach's alpha for both scales, Task Value and Anxiety. Below are step-by-step commands for calculating Cronbach's alpha in SPSS.
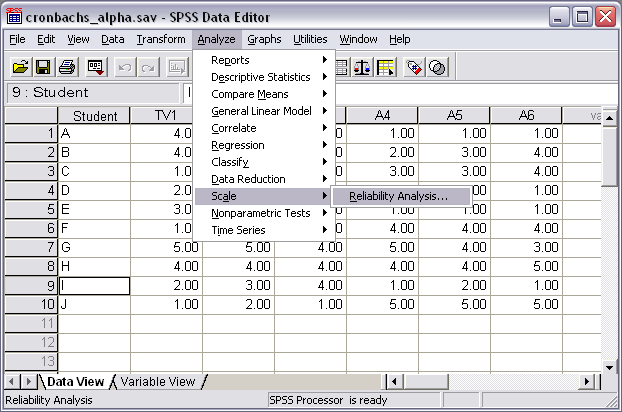
Step 1: Enter the data into SPSS as shown above in Table 3. After you finish data entry your SPSS screen should look something like Figure 1 below.
Figure 1: Data Entry of Task Value and Anxiety Items for each of Ten Students

Step 2:
(a) Select "Analyze"
(b) Select "Scale"
(c) Select "Reliability Analysis"
Figure 2 shows what your screen should now display.
Figure 2: Reliability Analysis Command

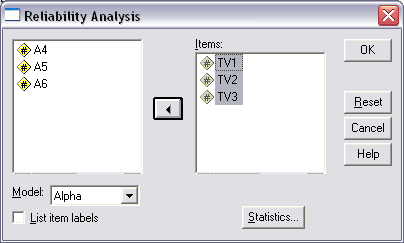
Step 3: A pop-up window will appear for reliability analysis. In this window are two boxes, one to the left and one to the right. The left contains the variables entered in SPSS (TV1, TV2, etc.), the box to the right, which is labeled "Items," is where one moves those variables for which Cronbach's alpha is desired. Note that I have selected the three Task Value variables in Figure 3.
Figure 3: Reliability Analysis Pop-up Window

In Figure 4, note that I have moved the three Task Value variables to the box on the right for these are the three for which I desire Cronbach's alpha. Once we run this analysis, Cronbach's alpha will be calculated for the three Task Value variables (items) to provide information about the internal consistency of those three items. If we also wanted to obtain Cronbach's alpha for the Anxiety items, would would need to re-run the analysis with only the Anxeity items appearing in the "Items:" box. To run Cronbach's alpha with both sets of items, Task Value and Anxiety, would be a mistake because those six items are not designed to measure the same construct and the alpha that would result would be uninterpretable.
Figure 4: Reliability Analysis Pop-up Window

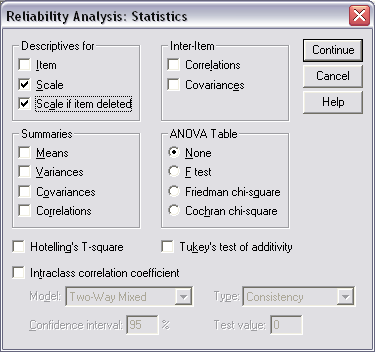
Step 4: Select desired statistics for the analysis. Click on the "Statistics" button which can be seen in Figure 4. Once that button is selected, a pop-up window labeled "Statistics" will appear. This window is displayed in Figure 5 below. Note in Figure 5 that I have placed a check mark next to "Scale" and "Scale if item deleted." You should also select those two. After selecting those two options, then click on the "Continue" button to return to the "Reliability Analysis" pop-up window displayed above in Figure 4, then click on the "OK" button to run the analysis.
Figure 5: Statistical Options for Reliability Analysis

Step 5: Analysis of results.
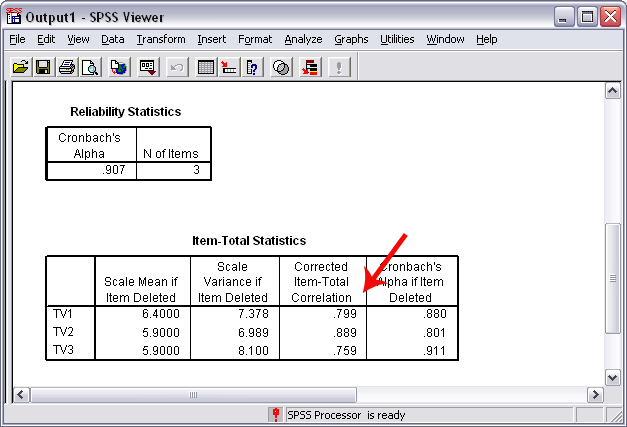
(a) Overall alpha: Now that Cronbach's alpha has been run for the three Task Value items, we must next examine the results. Figure 6 below displays some of the results obtained. The red arrow points to the overall alpha for the three Task Value items. As the results in Figure 6 show, overall alpha is .907, which is very high and indicates strong internal consistency among the three Task Value items. Essentially this means that respondents who tended to select high scores for one item also tended to select high scores for the others; similarly, respondents who selected a low scores for one item tended to select low scores for the other Task Value items. Thus, knowing the score for one Task Value item would enable one to predict with some accuracy the possible scores for the other two Task Value items. Had alpha been low, this ability to predict scores from one item would not be possible.
Figure 6: Statistical Results for Reliability Analysis (overall alpha highlighted)

(b) Corrected Item-Total Correlation: Figure 7 below highlights the column containing the "Corrected Item-Total Correlation" for each of the items. This column displays the correlation between a given Task Value item and the sum score of the other two items. For example, the correlation between Task Value item 1 and the sum of items 2 and 3 (i.e., item 2 + item 3) is r = .799. What this means is that there is a strong, positive correlation between the scores on the one item (item 1) and the combined score of the other two (items 2 and 3). This is a way to assess how well one item's score is internally consistent with composite scores from all other items that remain. If this correlation is weak (de Vaus suggests anything less than .30 is a weak correlation for item-analysis purposes [de Vaus (2004), Suveys in Social Research, Routledge, p. 184]), then that item should be removed and not used to form a composite score for the variable in question. For example, if the correlation between scores for item 1 and the combined scores of items 2 and 3 was low, say r = .15, then when we create the composite (overall) score for Task Value (the step taken after reliability analysis) we would create the composite using only items 2 and 3 and we would simply ignore scores from item 1 because it was not internally consistent with the other items.
Figure 7: Statistical Results for Reliability Analysis (Corrected Item-Total Correlation)

(c) Cronbach's Alpha if item Deleted: Figure 8 displays Cronbach's alpha that would result if a given item were deleted. Like the item-total correlation presented above in (b), this column of information is valuable for determining which items from among a set of items contributes to the total alpha. The value presented in this column represents the alpha value if the given item were not included. For example, for Task Value item 1, the Cronbach's alpha if item 1 was deleted would drop from the overall total of .907 to .880. Since alpha would drop with the removal of TV1, this item appears to be useful and contribute to the overall reliability of Task Value. Item 3, however is less certain. Cronbach's alpha would increase from .907 to .911 if item 3 were deleted or not used for computing an overall Task Value score. So should this item be removed and should the overall Task Value composite be created only from items 1 and 2? In this case the answer is no, we should instead retain all three items. Why? Note first that alpha does not increase by a large degree from deleting item 3. Second, note that item 3 still correlates very well with the composite score from items 1 and 2 (the item-total correlation for item 3 is .759). Since deletion of item 3 results in little change, and since item 3 correlates well with the composite of items 1 and 2, there is no statistical reason to drop item 3.
Figure 8: Statistical Results for Reliability Analysis (Cronbach's Alpha if item Deleted)

Step 6: When analysis of the contribution of each item is complete, that is analyses are run and re-run as needed to consider what happens when items are removed, then it is time to move toward creating the composite score for the construct in question. For example, from the analysis above it appears that all three items designed to measure Task Value work well and contribute to overall reliability of Task Value, so all will be retained. We must now create a total score for Task Value (or a mean score) for each study participant. Below, in Table 4, are scores for the three Task Value items for each student. Two new columns were added. The first shows how to create a total score for Task Value, the second a mean score for Task Value. When I create composite scores, I always use mean scores because they are constrained within the original scale of measurement, which, in this example, ranges from 1 to 5. Since mean scores are constrained within the original metric, they are therefore easier to interpret, that is, the mean score can be understood within the original scale. So, for instance, student A's mean score is 4.33 which means that student's scores were in the upper end of the range of responses whereas Student D's responses average toward the lower end of the results (close to 1).
Any additional analyses to answer research questions about Task Value would focus on the composite score. So, for instance, if one were interested in the difference in Task Value between males and females, one would perform the ANOVA or t-test using the mean Task Value score for each student (or, if you prefer, the total score). Similarly, if one wished to learn whether Task Value correlates with Anxiety, one would calculate Pearson's r between the mean scores of Task Value and Anxiety.
Table 4: Composite Score for Task Value
| Student | TV1 | TV2 | TV3 | Option 1---Total Score for Task Value | Option 2 --- Mean Score for Task Value |
| A | 4 | 5 | 4 | 4+5+4 = 13 | 4+5+4 = 13/3 = 4.33 |
| B | 4 | 4 | 5 | 4+4+5 = 13 | 4+4+5 = 13/3 = 4.33 |
| C | 1 | 3 | 4 | 1+3+4 = 8 | 1+3+4 = 8/3 = 2.66 |
| D | 2 | 1 | 2 | 2+1+2 = 5 | 2+1+2 = 5/3 = 1.66 |
| E | 3 | 4 | 3 | etc. | etc. |
| F | 1 | 1 | 1 | ||
| G | 5 | 5 | 4 | ||
| H | 4 | 4 | 4 | ||
| I | 2 | 3 | 4 | ||
| J | 1 | 2 | 1 |
Copyright © 2005, Bryan W. Griffin
Last revised on 11 January, 2018 03:11 PM