Pearson Correlation Coefficient with SPSS
Table of Contents
- Purpose of Pearson Correlation Coefficient
- Student Ratings Example
1. Purpose of Pearson Correlation Coefficient
The Pearson's product-moment correlation coefficient, symbolized as r, is an index that measures the linear association between two quantitative, continuous variables. Some example research situations and variables for which this statistical index would be suitable include:
- Determining whether number of hours studied per week is associated with scores on a mathematics achievement test;
- assessing whether number of mistakes made on a test correlate to levels of anxiety; and
- correlating time on task with a quantitative measure of student engagement.
2. Student Ratings Example
Students in 21 undergraduate courses in the College of Education completed evaluation questionnaires for their courses. The following items were among the 41 items found on the questionnaires (SPSS variable names in bold):
- overall_rating:
- Overall, how would you rate this instructor? (1 = Poor to 5 = Excellent)
- knowledge_gained:
- As a result of this instructor, you gained new knowledge of the content in this course. (1 = Strongly Disagree to 5 = Strongly Agree)
- grading_leniency:
- This instructor is a lenient/easy grader. (1 = Strongly Disagree to 5 = Strongly Agree)
- course_difficulty:
- Course difficulty, relative to other courses was: (1 = One of easiest to 5 = One of Most Difficult)
Data for this analysis consists of mean scores per class on each of the above variables. Of interest is which of knowledge gained, grading leniency, and course difficulty appear to be more strongly associated with overall ratings of the instructor provided by students.
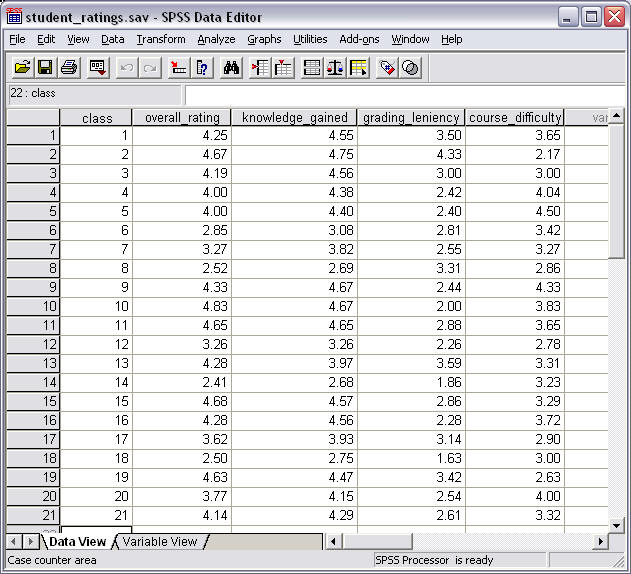
(a) Data Entry in SPSS
Figure 1 below provides an illustration for SPSS data entry of the four variables from the student ratings data.
Figure 1
SPSS Data Entry of Student Ratings by Class
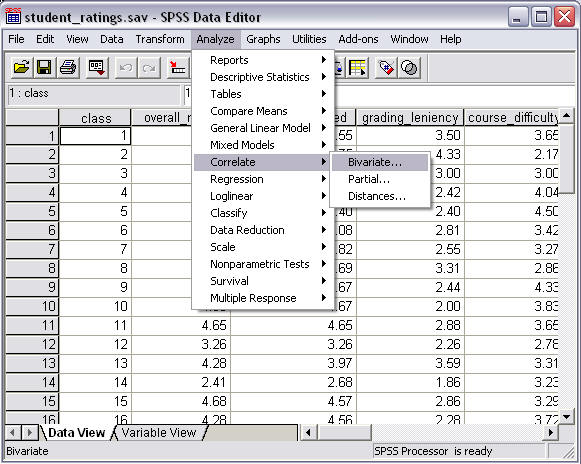
(b) Correlation Commands
To obtain Pearson correlation coefficients and summary descriptive statistics for each variable included in the analysis, run the following commands:
- Select "Analyze"
- Select "Correlate"
- Select "Bivariate"
These command selections are illustrated in Figure 2 below.
Figure 2
Correlation Command Selection
Once the "Bivariate Correlations" command is selected, the following pop-up window will appear (Figure 3):
Figure 3
Bivariate Correlations Window
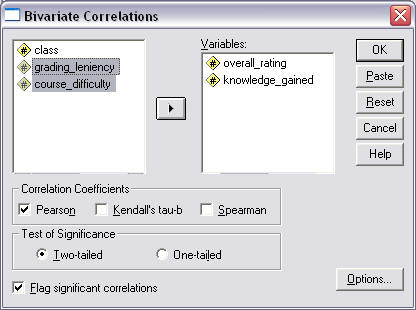
In the "Bivariate Correlations" (Figure 3) pop-up window, do the following:
- From the left box select those variables for which Pearson correlations are desired and move those variables to the right box entitled "Variables" then
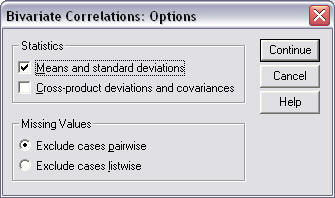
- click on "Options" to produce a new pop-up window entitled "Bivariate Correlations: Options" (see Figure 4 below) and place mark next to "Means and standard deviations" then click on "Continue;"
- lastly, when returned to the "Bivariate Correlations" window (Figure 3), click on "OK" to obtain results.
Figure 4
Bivariate Correlations: Options Window
(d) Results
SPSS results for the chi-square test of association are provided below in Figure 5.
Figure 5
Bivariate Correlation Results

The results presented above show two tables.
1. Descriptive Statistics
This table provides means, standard deviations, and sample size for variables included in the analysis. For example, Course Difficulty has M = 3.3766, SD = 0.57818, and n = 21.
2. Correlations
The second table presents three statistics for each variable combination: Pearson's correlation coefficient, p-value for the correlation coefficient (denoted as "Sig. (2-tailed)," and sample size for the correlation coefficient.
For example, consider the values encircled: the Pearson's correlation coefficient between Overall Rating and Knowledge Gained r = .957 with a p-value = .000 and n = 21.
As a second example, the values for Grading Leniency and Course Difficulty are r = -.467, p = .033, n = 21.
Copyright 2011, College of Education, Georgia Southern University
Created by Bryan W. Griffin
Thursday, August 18, 2011
18 August, 2011 11:55 AM